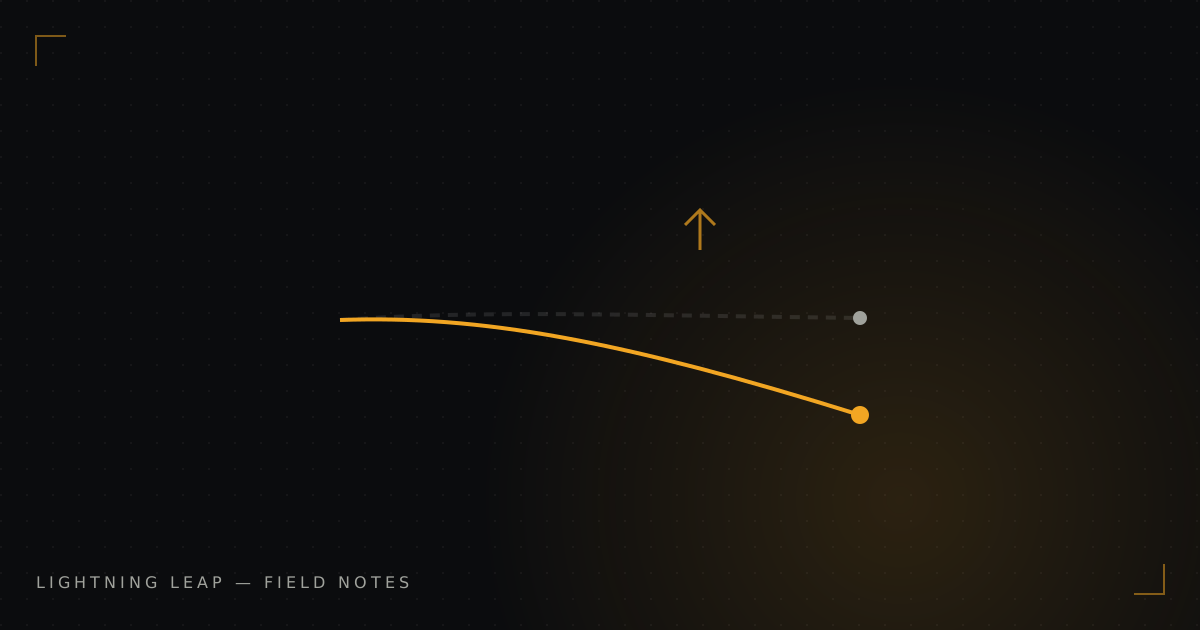
When a production model’s predictions start to diverge from reality, the most dangerous phase is the blind spot—when metrics look fine but the underlying data distribution has already shifted. This silent drift is the single biggest source of unexpected outages in AI‑driven products, and it demands a shift from reactive debugging to continuous, data‑centric vigilance.
12%
average performance loss after 3 months of undetected drift
78%
of incidents traced to silent drift
4×
increase in retraining cost when drift is caught late
Why Traditional Metrics Fail
Most teams rely on aggregate accuracy, loss, or AUC computed on a static hold‑out set. Those numbers are stable until the validation data itself becomes stale. Even a well‑engineered monitoring dashboard can miss a shift if the drift manifests in feature space rather than label distribution.Detecting Drift at the Feature Level
Implement two‑pronged checks: (1) statistical distance (e.g., KL divergence, Wasserstein) between live and reference feature histograms; (2) model‑agnostic explainability drift, such as SHAP value distribution changes. Both can be computed in near‑real time with streaming frameworks like Flink or Kafka Streams.Practical KPI Table
- Kolmogorov‑Smirnov (KS) p‑value — <0.01 — Flag for review
- Mean SHAP drift — >0.05 — Trigger retrain pipeline
- Data freshness lag — >24h — Alert ops